
Build a Live Goroutine Visualizer in Go: Detect Leaks in Any Running Process
I spend more time than I’d like chasing goroutine leaks. The symptom is always the same: runtime.NumGoroutine() climbs and never comes back down, memory follows it up, and a few hours later the service falls over for no reason you can pin on any single request. The count tells me something is wrong but not what: which goroutines, stuck where. The full pprof dump has that detail, but it’s thousands of near-identical stack traces with no way to see the shape.
There’s an old tool for this, GOM by Jaana Dogan, but it’s unmaintained. goroutine-inspect only works on a saved dump, not a live process. I wanted something that attaches to a running program, groups goroutines by where they’re stuck, and shows me the group that keeps growing. So I built it. It’s called goroscope and the code is on GitHub.
This is the same kind of terminal tool as my system monitor, just pointed inward at one process instead of the whole machine. Let’s build it.
What We Need
The whole thing is four steps:
- Collect: pull the goroutine dump over HTTP from the target’s pprof endpoint
- Parse: turn that text into structured goroutines
- Group: collapse goroutines with identical stacks into one row with a count
- Track: watch the counts over time; the one that keeps growing is the leak
The only thing the target program has to do is expose pprof, which most servers already do:
import _ "net/http/pprof"

go func() { log.Println(http.ListenAndServe("localhost:6060", nil)) }()
That blank import registers a handful of handlers under /debug/pprof/. The one we want is /debug/pprof/goroutine.
Something to Leak
To test a leak detector you need a leak. This server leaks one goroutine per request, the forgotten receiver: you start a goroutine that blocks on a channel nobody ever sends to.
// leak blocks forever on a channel that never receives, so the goroutine
// can't exit and every call adds one to the live count.
func leak(id int) {
    ch := make(chan struct{})
    <-ch
    _ = id // never reached
}

// healthyWork does real work and returns, so the dump isn't 100% leaks.
func healthyWork() {
    time.Sleep(50 * time.Millisecond)
}

func main() {
    var counter int
    mux := http.NewServeMux()

    mux.HandleFunc("/work", func(w http.ResponseWriter, r *http.Request) {
        counter++
        go leak(counter) // the bug: this goroutine never returns
        healthyWork()
        fmt.Fprintf(w, "did work #%d (and leaked a goroutine)\n", counter)
    })

    mux.HandleFunc("/healthy", func(w http.ResponseWriter, r *http.Request) {
        healthyWork()
        fmt.Fprintln(w, "did work, no leak")
    })

    go func() { log.Println(http.ListenAndServe("localhost:6060", nil)) }() // pprof
    log.Fatal(http.ListenAndServe("localhost:8080", mux))
}
Run it, hit /work a few times, and the goroutines pile up:
go run ./examples/leaky-server
curl "http://localhost:8080/work"   # repeat a few times
Getting the Dump
/debug/pprof/goroutine?debug=2 gives a full text stack for every live goroutine. One block from the leaky server:
goroutine 5 [chan receive]:
main.leak(...)
	/.../examples/leaky-server/main.go:23
created by main.main.func1 in goroutine 3
	/.../examples/leaky-server/main.go:39 +0x58
Everything I need is in there:
- the goroutine id (
5) - the state:
chan receive, it’s blocked receiving - the stack:
main.leak, line 23, our<-ch - where it was created:
main.main.func1, line 39, thego leak(counter)in the handler
Fetching it is a plain HTTP GET. I wrapped it in a Collector so nothing else has to know where the bytes come from:
type Collector struct {
    URL    string
    client *http.Client
}

func NewCollector(base string, timeout time.Duration) *Collector {
    base = strings.TrimRight(base, "/")
    if !strings.HasPrefix(base, "http") {
        base = "http://" + base
    }
    return &Collector{
        URL:    base + "/debug/pprof/goroutine?debug=2",
        client: &http.Client{Timeout: timeout},
    }
}

func (c *Collector) Fetch() ([]Goroutine, error) {
    resp, err := c.client.Get(c.URL)
    if err != nil {
        return nil, fmt.Errorf("reaching %s: %w", c.URL, err)
    }
    defer resp.Body.Close()
    if resp.StatusCode != http.StatusOK {
        return nil, fmt.Errorf("%s returned %s", c.URL, resp.Status)
    }
    body, err := io.ReadAll(resp.Body)
    if err != nil {
        return nil, fmt.Errorf("reading response: %w", err)
    }
    return Parse(string(body)), nil
}
Parse is next.
Parsing the Dump
Two types hold what I pull out of each block:
type Frame struct {
    Func string
    File string
    Line int
}

type Goroutine struct {
    ID        int
    State     string        // "running", "chan receive", "select", "IO wait", ...
    Wait      time.Duration // how long it's been blocked (0 if not reported)
    WaitText  string        // raw text, e.g. "5 minutes"
    Frames    []Frame       // top of stack first
    CreatedBy string        // function that started this goroutine, if known
}
Goroutines in the dump are separated by blank lines, so the top of the parser splits on those and hands each block off:
func Parse(dump string) []Goroutine {
    var out []Goroutine
    for _, block := range strings.Split(strings.ReplaceAll(dump, "\r\n", "\n"), "\n\n") {
        block = strings.TrimRight(block, "\n")
        if block == "" {
            continue
        }
        if g, ok := parseBlock(block); ok {
            out = append(out, g)
        }
    }
    return out
}
The first line of a block is goroutine 5 [chan receive]: or goroutine 18 [select, 5 minutes]:. A regex pulls the id and the bracket, then the bracket splits into a state and an optional wait:
var header = regexp.MustCompile(`^goroutine (\d+) \[([^\]]+)\]:$`)
var waitText = regexp.MustCompile(`(\d+)\s+(minutes?|hours?)`)

func parseBlock(block string) (Goroutine, bool) {
    lines := strings.Split(block, "\n")
    m := header.FindStringSubmatch(lines[0])
    if m == nil {
        return Goroutine{}, false
    }

    id, _ := strconv.Atoi(m[1])
    g := Goroutine{ID: id}

    // bracket is "state" or "state, 5 minutes"; the first field is the state
    g.State, _, _ = strings.Cut(m[2], ", ")
    if _, rest, hasRest := strings.Cut(m[2], ", "); hasRest {
        if w := waitText.FindStringSubmatch(rest); w != nil {
            g.WaitText = w[0]
            g.Wait = parseWait(w[1], w[2])
        }
    }
    // ... frames below ...
}
That wait value is worth keeping. When Go says a goroutine has been blocked [chan receive, 7 minutes], that’s a good sign it’s never waking up.
The rest of the block is the stack in pairs: a function line, then a tab-indented file:line +offset line, sometimes followed by a created by pair.
for i := 1; i < len(lines); i++ {
    line := lines[i]
    if strings.HasPrefix(line, "created by ") {
        g.CreatedBy = cleanFunc(strings.TrimPrefix(line, "created by "))
        i++ // skip the file line that follows
        continue
    }
    if strings.HasPrefix(line, "\t") {
        continue // stray file line
    }
    fr := Frame{Func: cleanFunc(line)}
    if i+1 < len(lines) && strings.HasPrefix(lines[i+1], "\t") {
        fr.File, fr.Line = parseFileLine(lines[i+1])
        i++
    }
    g.Frames = append(g.Frames, fr)
}
One detail caused me trouble. Function lines carry their arguments:
net/http.(*ServeMux).ServeHTTP(0x0?, {0x101429490, 0x157eb733a2d0}, 0x157eb727e500)
main.leak(...)
Those pointers differ for every goroutine, so if I keep them, two goroutines doing the same thing look different and won’t group. But I can’t strip everything in parentheses, since (*ServeMux) is a method receiver I want to keep. The argument list is always the last parenthesized group, so I cut there and leave the receiver alone:
func cleanFunc(s string) string {
    s = strings.TrimSpace(s)
    if before, _, found := strings.Cut(s, " in goroutine "); found {
        s = before
    }
    if strings.HasSuffix(s, ")") {
        if open := strings.LastIndex(s, "("); open != -1 {
            s = s[:open]
        }
    }
    return strings.TrimSpace(s)
}
So net/http.(*ServeMux).ServeHTTP(0x0?, ...) becomes net/http.(*ServeMux).ServeHTTP, and main.leak(...) becomes main.leak. The dump format has enough corners that I run the parser against a real captured dump saved at testdata/sample.txt (the test skips when you haven’t captured one yet):
$ go test -run TestParse -v
=== RUN   TestParseFields
--- PASS: TestParseFields (0.00s)
=== RUN   TestParseRealDump
    parse_test.go:93: parsed 10 goroutines, 6 leaking at main.leak
--- PASS: TestParseRealDump (0.00s)
PASS
Grouping by Stack
Grouping is what makes the tool useful. A leak is many goroutines sharing one stack. Ten thousand stuck in main.leak are ten thousand near-identical blocks in the dump, but they’re one problem. If I key each goroutine by the ordered list of its function names, identical stacks collapse to a single group with a count.
type Group struct {
    Signature string  // join of every frame's function name
    Count     int     // goroutines sharing this stack right now
    Delta     int     // change in Count since we first saw this group
    State     string  // representative state, e.g. "chan receive"
    Where     string  // first non-runtime function, where it's parked
    WhereFile string
    WhereLine int
    CreatedBy string
    Stack     []Frame
}
The signature is the function names joined together, no ids, no pointers:
func signature(g Goroutine) string {
    var b strings.Builder
    for _, f := range g.Frames {
        b.WriteString(f.Func)
        b.WriteByte('\n')
    }
    return b.String()
}
Aggregating is one pass: count the total, count by state, fold each goroutine into its group:
func Aggregate(gs []Goroutine) Snapshot {
    snap := Snapshot{ByState: map[string]int{}}
    bySig := map[string]*Group{}

    for _, g := range gs {
        snap.Total++
        snap.ByState[g.State]++

        sig := signature(g)
        grp := bySig[sig]
        if grp == nil {
            where, file, line := whereParked(g)
            grp = &Group{
                Signature: sig, State: g.State,
                Where: where, WhereFile: file, WhereLine: line,
                CreatedBy: g.CreatedBy, Stack: g.Frames,
            }
            bySig[sig] = grp
        }
        grp.Count++
    }

    for _, grp := range bySig {
        snap.Groups = append(snap.Groups, *grp)
    }
    sortGroups(snap.Groups) // biggest first
    return snap
}
The top of a blocked goroutine’s stack is usually runtime plumbing (runtime.gopark, internal/poll.*), not my code. The line I care about is the first frame that’s mine, so whereParked skips the plumbing:
func whereParked(g Goroutine) (string, string, int) {
    for _, f := range g.Frames {
        if isPlumbing(f.Func) { // runtime., internal/poll., syscall., ...
            continue
        }
        return f.Func, f.File, f.Line
    }
    if len(g.Frames) > 0 {
        f := g.Frames[0]
        return f.Func, f.File, f.Line
    }
    return "?", "", 0
}
Tracking Growth
One snapshot shows the shape right now. To call something a leak I need two snapshots and the fact that a group got bigger. So I keep a Tracker that remembers the first count it saw for each signature, plus a short history of the total for a sparkline:
type Tracker struct {
    baseline   map[string]int
    history    []int
    maxHistory int
}

func (t *Tracker) Observe(snap Snapshot) Snapshot {
    for i := range snap.Groups {
        g := &snap.Groups[i]
        base, seen := t.baseline[g.Signature]
        if !seen {
            t.baseline[g.Signature] = g.Count
            base = g.Count
        }
        g.Delta = g.Count - base // growth since first sighting
    }
    sortGroups(snap.Groups)

    t.history = append(t.history, snap.Total)
    if len(t.history) > t.maxHistory {
        t.history = t.history[len(t.history)-t.maxHistory:]
    }
    return snap
}
Now “is this a leak” has a concrete answer: it grew since I started watching, and there are enough of them to bother with.
const leakMinCount = 3

func (g Group) IsLeakSuspect() bool {
    return g.Delta > 0 && g.Count >= leakMinCount
}
A Text Report First
Before the full-screen view I added a -snapshot mode that prints once and exits. It’s easy to test, easy to pipe into a log, and it’s the quickest way to see the grouping work:
func runSnapshot(w io.Writer, c *Collector, top int) error {
    gs, err := c.Fetch()
    if err != nil {
        return fmt.Errorf("fetch goroutines: %w", err)
    }
    snap := Aggregate(gs)

    fmt.Fprintf(w, "goroscope  ▸ %s\n", c.URL)
    fmt.Fprintf(w, "%s in %s\n\n",
        plural(snap.Total, "goroutine"), plural(len(snap.Groups), "distinct stack"))
    fmt.Fprintf(w, "STATES  %s\n\n", stateSummary(snap.ByState))

    fmt.Fprintf(w, "  %-6s %-14s %s\n", "COUNT", "STATE", "WHERE")
    for i, g := range snap.Groups {
        if i >= top {
            fmt.Fprintf(w, "  ... %d more stacks\n", len(snap.Groups)-top)
            break
        }
        where := g.Where
        if g.WhereFile != "" {
            where = fmt.Sprintf("%s  (%s:%d)", g.Where, shortFile(g.WhereFile), g.WhereLine)
        }
        fmt.Fprintf(w, "  %-6d %-14s %s\n", g.Count, g.State, where)
    }
    return nil
}
Against the leaky server, after a few /work requests:
$ goroscope -snapshot
goroscope  ▸ http://localhost:6060/debug/pprof/goroutine?debug=2
10 goroutines in 5 distinct stacks

STATES  chan receive:6  IO wait:2  runnable:1  running:1

  COUNT  STATE          WHERE
  6      chan receive   main.leak  (leaky-server/main.go:23)
  1      running        net/http/pprof.handler.ServeHTTP  (pprof/pprof.go:273)
  1      IO wait        net.(*netFD).accept  (net/fd_unix.go:150)
  1      IO wait        net.(*netFD).accept  (net/fd_unix.go:150)
  1      runnable       net.(*netFD).Read  (net/fd_posix.go:68)
Ten goroutines, five distinct stacks, six of them sitting in main.leak at line 23. Hit /work eight more times and snapshot again:
$ goroscope -snapshot
goroscope  ▸ http://localhost:6060/debug/pprof/goroutine?debug=2
18 goroutines in 5 distinct stacks

STATES  chan receive:14  IO wait:3  running:1

  COUNT  STATE          WHERE
  14     chan receive   main.leak  (leaky-server/main.go:23)
  1      IO wait        net.(*netFD).Read  (net/fd_posix.go:68)
  1      running        net/http/pprof.handler.ServeHTTP  (pprof/pprof.go:273)
  1      IO wait        net.(*netFD).accept  (net/fd_unix.go:150)
  1      IO wait        net.(*netFD).accept  (net/fd_unix.go:150)
main.leak went from 6 to 14, every other group stayed flat. Eight requests, eight leaked goroutines, pointing at the exact line. The live view turns that into something you can watch.
The Live View
For real time I used tcell, the same terminal library as the system monitor, so the drawing primitive is the same. It works one cell at a time:
func drawText(s tcell.Screen, x, y int, text string, style tcell.Style) {
    for _, r := range text {
        s.SetContent(x, y, r, nil, style)
        x++
    }
}
The loop does two things: redraw on a timer and react to keys. The cleanest way to get both is to make “the interval elapsed” into an event, so a single PollEvent loop handles everything. A custom event type is all that takes:
type tick struct{ at time.Time }

func (t tick) When() time.Time { return t.at }

// a goroutine posts one every interval:
go func() {
    t := time.NewTicker(interval)
    defer t.Stop()
    for {
        select {
        case <-stop:
            return
        case now := <-t.C:
            screen.PostEvent(tick{now})
        }
    }
}()
Then the main loop treats a tick like any other event:
for {
    switch ev := screen.PollEvent().(type) {
    case *tcell.EventResize:
        screen.Sync()
        u.draw()
    case tick:
        u.refresh() // refetch, re-aggregate, tracker.Observe
        u.draw()
    case *tcell.EventKey:
        if u.handleKey(ev) {
            return nil
        }
        u.draw()
    }
}
Drawing is the same snapshot as the text mode, with color carrying the meaning. A leak suspect is red, a group that’s only grown is yellow, everything else plain:
switch {
case g.IsLeakSuspect():
    style = red.Bold(true)
case g.Delta > 0:
    style = yellow
}
I also wanted the total to show its direction at a glance, so the history feeds a one-line sparkline built from block runes:
func sparkline(vals []int) string {
    if len(vals) == 0 {
        return ""
    }
    blocks := []rune("▁▂▃▄▅▆▇█")
    lo, hi := vals[0], vals[0]
    for _, v := range vals {
        lo = min(lo, v)
        hi = max(hi, v)
    }
    out := make([]rune, len(vals))
    for i, v := range vals {
        idx := 0
        if hi > lo {
            idx = (v - lo) * (len(blocks) - 1) / (hi - lo)
        }
        out[i] = blocks[idx]
    }
    return string(out)
}
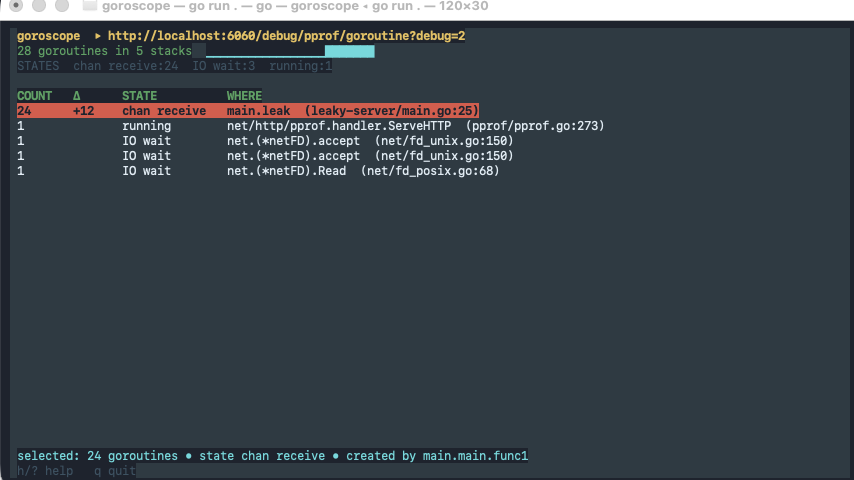
Point it at the leaky server, fire some requests, and the leak shows up as one red row whose count and Δ keep climbing:
goroscope  ▸ http://localhost:6060/debug/pprof/goroutine?debug=2
18 goroutines in 5 stacks  ▁▄█
STATES  chan receive:14  IO wait:3  running:1

COUNT   Δ      STATE          WHERE
14      +8     chan receive   main.leak  (leaky-server/main.go:23)
1              running        net/http/pprof.handler.ServeHTTP  (pprof/pprof.go:273)
1              IO wait        net.(*netFD).accept  (net/fd_unix.go:150)
1              IO wait        net.(*netFD).accept  (net/fd_unix.go:150)
1              IO wait        net.(*netFD).Read  (net/fd_posix.go:68)

selected: 14 goroutines • state chan receive • created by main.main.func1
The Δ +8 is what matters. The count isn’t just high, it’s higher than when I started looking, and it doesn’t come back down. That’s a leak and not a busy moment.
Testing the TUI
A terminal UI sounds untestable, but tcell ships a SimulationScreen that renders to memory instead of a real terminal. So I drive the dashboard with two synthetic snapshots, 6 leaks then 14, read the cells back as text, and check the growth shows up:
func TestDashboardShowsGrowingLeak(t *testing.T) {
    u := &ui{collector: NewCollector("http://localhost:6060", 0), tracker: NewTracker(120), top: 20}
    u.snap = u.tracker.Observe(Aggregate(Parse(sixLeaks)))      // baseline
    u.snap = u.tracker.Observe(Aggregate(Parse(fourteenLeaks))) // +8

    out := renderUI(t, u, 90, 16) // draw onto a SimulationScreen, read cells back
    for _, want := range []string{"goroscope", "14 goroutines", "main.leak", "+8", "chan receive"} {
        if !strings.Contains(out, want) {
            t.Errorf("dashboard missing %q", want)
        }
    }
    if u.snap.Groups[0].Where != "main.leak" || !u.snap.Groups[0].IsLeakSuspect() {
        t.Errorf("top group should be the flagged leak, got %+v", u.snap.Groups[0])
    }
}
Parse, aggregate, track, render: all covered with no real terminal and no network.
Running It
Point it at any process with pprof on:
goroscope                    # watch http://localhost:6060
goroscope -url host:6060     # a different target
goroscope -snapshot          # one report and exit
goroscope -interval 500ms    # poll faster
In live mode, ↑/↓ selects a group, h/? toggles the help line, and q or Esc quits.
That’s the whole tool: pull the dump, parse it, group by stack, watch the groups grow. The leak that was hidden behind a rising NumGoroutine is now one red line with a source location next to it.
Two things I might add next: a detail pane that prints the full stack of the selected group, and a CI mode that snapshots, runs a load test, snapshots again, and fails if any group grew. Leak detection as a regression test.
If the channel-blocking part is new to you, my older post on Go channels covers why these goroutines park the way they do.
Full code (the tool, the tests, and the leaky demo server) is on GitHub.