
Build a Terminal System Monitor in Go: CPU, Memory & Processes
I wanted to build a tool that shows me what’s happening on my system in real-time - CPU usage, memory consumption, network activity, and resource-hungry processes. Let’s build it together!
Understanding What We Need
To monitor a system, we need several pieces of information:
- Memory usage (total, used, free)
- CPU utilization percentage
- Network I/O statistics
- Running processes and their resource usage
Go has a great package called gopsutil that can give us all this information. Let’s explore what we need:
import (
    "github.com/shirou/gopsutil/v3/cpu"
    "github.com/shirou/gopsutil/v3/mem"
    "github.com/shirou/gopsutil/v3/net"
    "github.com/shirou/gopsutil/v3/process"
)
Let’s see how each part works:
Memory Information
The mem package gives us memory statistics:
v, _ := mem.VirtualMemory()
fmt.Printf("Total: %v, Used: %v, Free: %v\n", v.Total, v.Used, v.Free)
This gives us:
- Total memory (v.Total)
- Used memory (v.Used)
- Free memory (v.Free)
- Usage percentage (v.UsedPercent)
CPU Usage
The cpu package shows CPU utilization:
// Get CPU percentage (false = all CPUs combined)
percentages, _ := cpu.Percent(0, false)
cpuUsed := percentages[0] // Overall CPU usage percentage
The Percent() function:
- First argument (0) means immediate reading
- Second argument (false) means get total usage, not per CPU
- Returns percentage of CPU in use
Network Statistics
The net package provides network I/O information:
// Get network stats (false = all interfaces combined)
netStats, _ := net.IOCounters(false)
stats := netStats[0]  // Overall network statistics

// Available fields:
// - BytesSent
// - BytesRecv
// - PacketsSent
// - PacketsRecv
This gives us sent/received bytes and packets across all network interfaces.
Process Information
The process package lets us see what each process is doing:
processes, _ := process.Processes()
for _, p := range processes {
    name, _ := p.Name()
    cpu, _ := p.CPUPercent()
    mem, _ := p.MemoryPercent()
    memInfo, _ := p.MemoryInfo()
}
For each process we can get:
- Process name and PID
- CPU usage percentage
- Memory usage percentage
- Actual memory size (RSS - Resident Set Size)
Building Our Display
We want to show all this in the terminal, so we’ll use tcell for the UI:
import "github.com/gdamore/tcell/v2"
Let’s create a structure to hold process information that we’ll display:
type ProcessInfo struct {
    PID     int32
    Name    string
    CPU     float64
    Memory  float64
    MemSize uint64
}
Now we can write a function to gather all process information:
func getProcessInfo() []ProcessInfo {
    processes, _ := process.Processes()
    var processInfo []ProcessInfo

    for _, p := range processes {
        name, _ := p.Name()
        cpu, _ := p.CPUPercent()
        mem, _ := p.MemoryPercent()
        memInfo, _ := p.MemoryInfo()

        if memInfo != nil {
            processInfo = append(processInfo, ProcessInfo{
                PID:     p.Pid,
                Name:    name,
                CPU:     cpu,
                Memory:  float64(mem),
                MemSize: memInfo.RSS,
            })
        }
    }
    return processInfo
}
We want to show the top resource-using processes, so let’s add sorting:
func sortByMemory(processes []ProcessInfo) []ProcessInfo {
    sort.Slice(processes, func(i, j int) bool {
        return processes[i].MemSize > processes[j].MemSize
    })
    if len(processes) > 10 {
        processes = processes[:10]
    }
    return processes
}

func sortByCPU(processes []ProcessInfo) []ProcessInfo {
    sort.Slice(processes, func(i, j int) bool {
        return processes[i].CPU > processes[j].CPU
    })
    if len(processes) > 10 {
        processes = processes[:10]
    }
    return processes
}
Putting It All Together
Now we have all the pieces to gather system information. Let’s create the main update function that will collect everything:
func updateScreen(screen tcell.Screen) {
    screen.Clear()
    width, height := screen.Size()

    // Get memory stats
    v, _ := mem.VirtualMemory()
    memUsed := float64(v.Used) / float64(v.Total) * 100

    // Draw memory bar with detailed info
    drawBar(screen, 1, 1, width-2, "Memory", memUsed,
        fmt.Sprintf("Total: %.2fGB Used: %.2fGB Free: %.2fGB (%.1f%%)",
            float64(v.Total)/1024/1024/1024,
            float64(v.Used)/1024/1024/1024,
            float64(v.Free)/1024/1024/1024,
            memUsed))

    // Get and display CPU usage
    c, _ := cpu.Percent(0, false)
    cpuUsed := c[0]
    drawBar(screen, 1, 3, width-2, "CPU", cpuUsed,
        fmt.Sprintf("Usage: %.1f%%", cpuUsed))

    // Get and display network stats
    n, _ := net.IOCounters(false)
    netStats := fmt.Sprintf("Network - Received: %.2fMB (%d pkts) Sent: %.2fMB (%d pkts)",
        float64(n[0].BytesRecv)/1024/1024,
        n[0].PacketsRecv,
        float64(n[0].BytesSent)/1024/1024,
        n[0].PacketsSent)
    drawText(screen, 1, 5, netStats, tcell.StyleDefault.Foreground(tcell.ColorGreen))

    // Get and display process information
    processes := getProcessInfo()
    drawProcessTable(screen, 1, 7, width/2-1, height-7, "Top Memory Usage", sortByMemory(processes))
    drawProcessTable(screen, width/2+1, 7, width/2-2, height-7, "Top CPU Usage", sortByCPU(processes))

    screen.Show()
}
Adding Visual Components
Now that we can collect system metrics, we need to display them nicely. We’ll use the tcell library to create a terminal UI with:
- Progress bars for CPU and memory
- Formatted text for network stats
- Tables for process information
Let’s start with the basic text display function:
func drawText(screen tcell.Screen, x, y int, text string, style tcell.Style) {
    for i, r := range text {
        screen.SetContent(x+i, y, r, nil, style)
    }
}
This function is pretty straightforward - it puts text at any position (x,y) on the screen with a given style. We’ll use this as a building block for our more complex displays.
Next, let’s create nice-looking progress bars for CPU and memory:
func drawBar(screen tcell.Screen, x, y, width int, label string, value float64, stats string) {
    barWidth := width - 2  // Leave space for [ and ]
    filled := int(float64(barWidth) * value / 100)

    // Draw the label and stats in yellow
    drawText(screen, x, y, label+": "+stats,
        tcell.StyleDefault.Foreground(tcell.ColorYellow))

    // Draw the bar border and fill
    screen.SetContent(x, y+1, '[', nil, tcell.StyleDefault)
    for i := 0; i < barWidth; i++ {
        char := ' '
        style := tcell.StyleDefault.Background(tcell.ColorDarkGray)
        if i < filled {
            style = tcell.StyleDefault.Background(tcell.ColorGreen)
        }
        screen.SetContent(x+1+i, y+1, char, nil, style)
    }
    screen.SetContent(x+barWidth+1, y+1, ']', nil, tcell.StyleDefault)
}
This creates a progress bar that looks like:
Memory: Total: 16.00GB Used: 8.50GB Free: 7.50GB (53.1%)
[██████████████████████                ]
Now for displaying process information in a table:
func drawProcessTable(screen tcell.Screen, x, y, width, height int, title string, processes []ProcessInfo) {
    // Draw table title in yellow
    drawText(screen, x, y, title, tcell.StyleDefault.Foreground(tcell.ColorYellow))

    // Draw column headers in green
    drawText(screen, x, y+1, fmt.Sprintf("%-6s %-20s %-10s %-10s",
        "PID", "Name", "CPU%", "Memory"),
        tcell.StyleDefault.Foreground(tcell.ColorGreen))

    // Draw each process row
    for i, p := range processes {
        if i >= height-3 {  // Leave space for title and headers
            break
        }
        drawText(screen, x, y+2+i, fmt.Sprintf("%-6d %-20s %-10.1f %-10.1f",
            p.PID, truncateString(p.Name, 20), p.CPU, p.Memory),
            tcell.StyleDefault)
    }
}

// Helper to prevent long process names from breaking the layout
func truncateString(s string, length int) string {
    if len(s) <= length {
        return s
    }
    return s[:length-3] + "..."
}
This creates tables that look like:
Top Memory Usage
PID    Name                 CPU%       Memory
1234   chrome              15.5       234.5
5678   vscode              12.3       185.7
Making It Update in Real-time
We want our display to update every second. Let’s set up the main program structure:
func main() {
    // Initialize screen
    screen, err := tcell.NewScreen()
    if err != nil {
        fmt.Fprintf(os.Stderr, "%v\n", err)
        os.Exit(1)
    }

    if err := screen.Init(); err != nil {
        fmt.Fprintf(os.Stderr, "%v\n", err)
        os.Exit(1)
    }

    // Clean up on exit
    defer screen.Fini()

    // Set default colors
    screen.SetStyle(tcell.StyleDefault.
        Background(tcell.ColorBlack).
        Foreground(tcell.ColorWhite))
    screen.Clear()

    // Set up clean shutdown
    ctx, cancel := context.WithCancel(context.Background())
    defer cancel()

    // Handle Ctrl+C gracefully
    sigChan := make(chan os.Signal, 1)
    signal.Notify(sigChan, os.Interrupt, syscall.SIGTERM)

    // Start update loop
    var wg sync.WaitGroup
    wg.Add(1)
    go func() {
        defer wg.Done()
        for {
            select {
            case <-ctx.Done():
                return
            case <-sigChan:
                cancel()
                return
            default:
                updateScreen(screen)
                time.Sleep(1 * time.Second)
            }
        }
    }()

    // Handle keyboard input
    for {
        switch ev := screen.PollEvent().(type) {
        case *tcell.EventKey:
            if ev.Key() == tcell.KeyEscape {
                cancel()
                return
            }
        case *tcell.EventResize:
            screen.Sync()
        }
    }
}
This setup:
- Initializes the terminal screen
- Creates a goroutine that updates the display every second
- Handles window resizing
- Allows clean exit with ESC or Ctrl+C
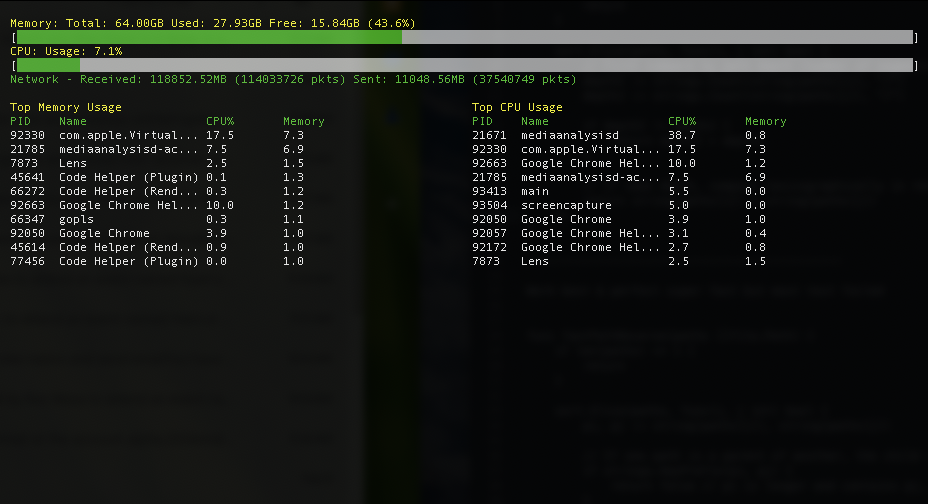
Run the program and you’ll see:
- Top section: Memory and CPU bars updating in real-time
- Middle: Current network traffic statistics
- Bottom half: Two tables showing top processes by memory and CPU usage
- Everything updates automatically every second
- ESC or Ctrl+C to exit cleanly
The program gives us a clear view of system resource usage with a responsive, easy-to-read interface. You can leave it running to monitor system behavior or spot resource-hungry processes.
Full code available on GitHub.